
How Businesses Can Work Smarter With Data and Automation
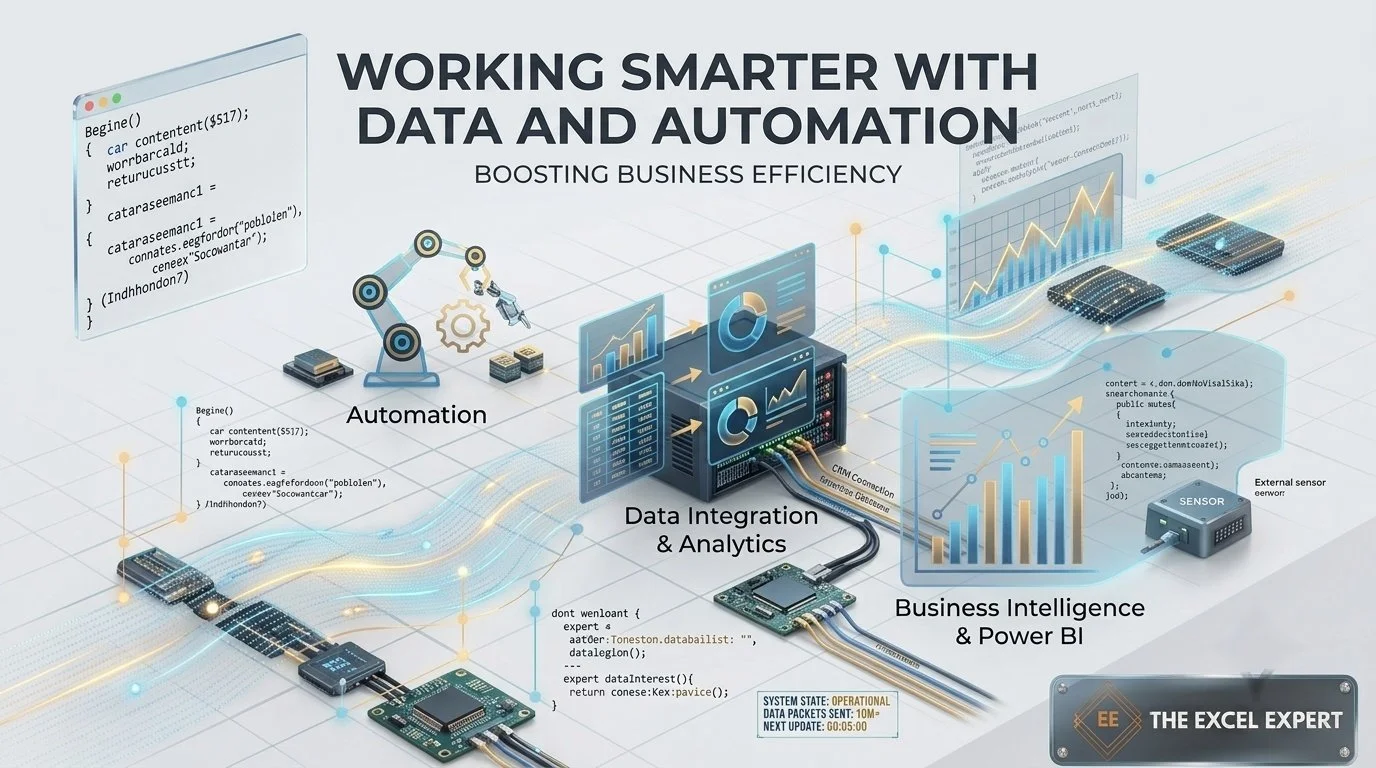
Every business wants to work more efficiently. But as a company grows, managing day-to-day information can become increasingly difficult. Sales figures, customer records, inventory, expenses, financial reports, supplier information and operational data all need to be managed regularly.
The challenge isn't necessarily having too much data. It is often the time businesses spend collecting, organizing, checking and updating that data manually. When employees spend hours preparing reports or moving information between spreadsheets and systems, there is less time available for analysis, planning and other work that supports business growth.
This is where better data management, analytics and automation can make a real difference.
Why Manual Processes Become a Problem
Many businesses start with simple spreadsheets and manual processes because they are practical and easy to set up. A sales team might maintain an Excel file, finance may have separate spreadsheets for expenses and budgets, and operations may use another file for inventory or performance tracking.
This can work well when the business is small. However, as the company grows, so does the amount of information it needs to manage. More customers, products, transactions and departments often mean more spreadsheets, more reporting and more manual work.
Over time, employees can find themselves spending hours copying data, checking formulas, combining files and preparing the same reports every week or month. This can lead to errors, outdated information, different versions of the same report and delays in getting important information to management.
The problem isn't always the tools being used. In many cases, it is the process behind them.
Start With Better Data
Before thinking about automation or artificial intelligence, businesses need a reliable way to manage their data. Useful information is often spread across different sources, with sales data in a CRM, financial information in accounting software and operational data maintained in Excel. When these sources are disconnected, getting a complete view of the business can become difficult.
Data integration can bring information together so teams can work with more consistent and accessible data. Instead of repeatedly moving information between files and systems, businesses can create a more structured way to collect, organize and use their data. The goal isn't to collect more information simply for the sake of it, but to make data easier to access, understand and use for better business decisions.
Turn Data Into Useful Insights
Having large amounts of data does not automatically lead to better decisions. Businesses need to understand what their data is telling them and turn it into information they can actually use.
For example, a company may have thousands of sales transactions, but management may want to know which products are performing best, which customers generate the most revenue, whether sales are improving and where costs are increasing. Data analytics and business intelligence can turn raw information into useful insights, helping teams identify important trends without spending hours reviewing rows and columns. This gives management a clearer view of actual business performance and supports more informed decisions.
Make Business Information Easier to Understand
Most managers don't want to spend their morning going through several spreadsheets just to understand what is happening in the business. They need important information presented clearly and in a way that supports quick decisions. A well-designed dashboard can bring key information together in one place, making it easier to monitor performance and spot important changes.
Depending on the business, a dashboard could include sales performance, revenue, profitability, inventory, customer activity, operational KPIs, financial performance or supply chain information. Excel can handle many reporting requirements, while Power BI can provide more interactive dashboards and business intelligence capabilities. The important thing isn't how many charts or graphs a dashboard contains, but whether it helps people understand the business and act on the information.
Stop Repeating the Same Work
One of the easiest places to identify an automation opportunity is in recurring reporting. Think about a report your team prepares every Monday: someone downloads several files, combines them, cleans the data, applies formulas, checks the results, formats the report and sends it to management. If the same steps are repeated every week, much of the process may be automated using Excel automation, Power Query, VBA and other tools. The goal isn't to replace the person preparing the report, but to reduce repetitive manual work so they can spend more time analyzing results, solving problems and focusing on higher-value tasks.
Excel Is Still a Powerful Business Tool
With so much attention on newer technologies, it can be easy to assume that businesses need to move away from Excel. In reality, Excel remains one of the most useful tools for business, supporting reporting, budgeting, forecasting, financial modeling, analysis, planning and everyday operations. The issue is usually not Excel itself, but how the spreadsheet is designed and how much manual work is required to maintain it. A well-designed Excel solution can automate calculations, organize information, combine data and produce recurring reports with far less manual effort, making it a practical first step for companies looking to improve their processes before investing in larger technology projects.
When Power BI Makes Sense
Excel is excellent for many business tasks, but some organizations need more advanced reporting and visualization. This is where Power BI can add significant value. Power BI can connect to different data sources and turn business information into interactive dashboards, making it easier for management to understand performance and identify important trends.
Management can explore information by product, customer, region, department or time period without having to work through multiple spreadsheets. Excel and Power BI don't necessarily need to compete with each other. In many businesses, they work better together, with Excel supporting day-to-day analysis and processes while Power BI provides a more centralized and interactive view of overall business performance.
Better Financial Planning and Forecasting
Businesses also need to understand where they are going, not just where they have been. Financial modeling and forecasting can help companies plan for different scenarios and understand how future decisions may affect the business. A well-designed financial model can be used to evaluate revenue projections, budgets, expenses, profitability, cash flow, pricing decisions and growth plans.
For example, management may want to understand what could happen if sales increase, operating costs rise or the company opens a new location. A financial model makes it easier to compare different scenarios and assess potential outcomes before making an important decision. This gives businesses a more structured way to plan ahead, manage resources and make more informed financial decisions.
Connect the Data You Already Have
Another common challenge is that business information is often spread across different systems. The sales team may use a CRM, finance may rely on accounting software, operations may work in Excel, and inventory information may sit in an ERP or database. When these systems don't communicate effectively, employees often end up acting as the connection between them. They may need to export files, copy information, clean the data and prepare it for reporting, often repeating the same process every week or month.
This creates unnecessary work and increases the risk of errors. Data integration can help connect different sources and create a more efficient flow of information. Instead of repeatedly transferring data manually, businesses can build processes that allow information to move where it is needed, giving teams more reliable data and more time to focus on analysis and decision-making.
Where AI Fits Into Business
Artificial intelligence is becoming increasingly useful across many areas of business, but it isn't automatically the answer to every problem. Before introducing AI, businesses should first understand what they are trying to improve. AI can support areas such as data analysis, document processing, forecasting, workflow assistance and other information-heavy tasks, helping teams handle certain processes more efficiently.
However, if the underlying process is unclear or poorly organized, adding AI may not solve the real problem. Sometimes a simple Excel automation or Power BI dashboard is all a business needs, while in other situations, a more advanced AI-powered solution may provide greater value. The right technology depends on the problem, the data and the goals of the business.
Every Business Has Different Needs
There is no single technology solution that works for every company. Every business has different processes, systems, data and priorities, so the right solution should be based on what the organization actually needs rather than simply following the latest technology trend.
A manufacturing company may need better production and inventory reporting, while a retailer may want improved sales and stock visibility. A finance team may need a more reliable forecasting model, while a logistics company may want to automate operational reporting. A healthcare organization may need better data management, while a technology or SaaS company may need to connect information from several systems and create management dashboards. For smaller businesses, a well-designed Excel solution may be enough, while larger organizations may benefit from Power BI, data integration, process automation or AI.
The technology may differ, but the objective is often similar: reduce unnecessary manual work, improve access to information and help people make better decisions. The best solution is not necessarily the most complicated one. It is the one that fits the business, solves a genuine problem and can continue to provide value as the company grows.
Where Should You Start?
Businesses don't need to automate everything at once. In many cases, starting with one inefficient process is the better approach. Look at the tasks your team performs repeatedly. Which report takes the most time to prepare? Where is information being copied manually? Which processes create the most errors? What information does management struggle to access? These questions can help identify where automation or better reporting could make the biggest difference.
Once the problem is clear, the next step is choosing the right solution. Depending on your needs, that could be Excel, Power BI, data analytics, process automation, financial modeling, data integration, or AI. The goal is to choose a solution that fits your business rather than adding technology that doesn't solve a real problem.
How The Excel Expert Can Help
At The Excel Expert, we help businesses get more value from their data and improve the way they work. Our services include Excel Automation & Consulting, Power BI Consulting & Dashboards, Data Analytics & Business Intelligence, Business Process Automation, Financial Modeling & Forecasting, Data Integration & Database Solutions, and AI & Intelligent Business Automation.
We work with businesses across FMCG and consumer goods, manufacturing, supply chain and logistics, finance and accounting, retail and e-commerce, pharmaceutical and healthcare, textile and apparel, and technology and SaaS. Whether you need a better Excel solution, a Power BI dashboard, an automated workflow, a financial model, connected data sources, or an AI-powered solution, we focus on understanding your business needs first and then choosing the technology that makes the most sense.
Conclusion
Working smarter doesn't always require a complicated technology project. It can start with something as simple as automating a report that takes several hours to prepare every week. It can mean bringing scattered data together so management can see the bigger picture, replacing difficult spreadsheets with a clear dashboard, improving financial forecasting, or introducing automation into a repetitive business process. The best technology solutions are the ones that solve real business problems.
By combining data, analytics, automation, financial planning, integration and intelligent technology, businesses can reduce repetitive work, improve visibility and make decisions with greater confidence. The goal isn't to use technology simply because it is available. The goal is to use the right technology to help your business work better.
Frequently Asked Questions
1. What is business automation?
Business automation uses technology to reduce repetitive manual tasks and make business processes more efficient.
2. How can data analytics help businesses?
Data analytics turns business data into useful insights, helping teams understand performance, identify trends and make better decisions.
3. Can Excel be used for business automation?
Yes. Excel can automate reporting, calculations, data processing and repetitive tasks using tools such as Power Query, VBA and formulas.
4. What is Power BI used for?
Power BI helps businesses analyze data and create interactive dashboards for reporting, performance tracking and decision-making.
5. How can AI help businesses?
AI can support data analysis, forecasting, document processing and workflow automation, depending on the business's needs.