
Excel for Teachers: The Complete Grade Tracking Guide
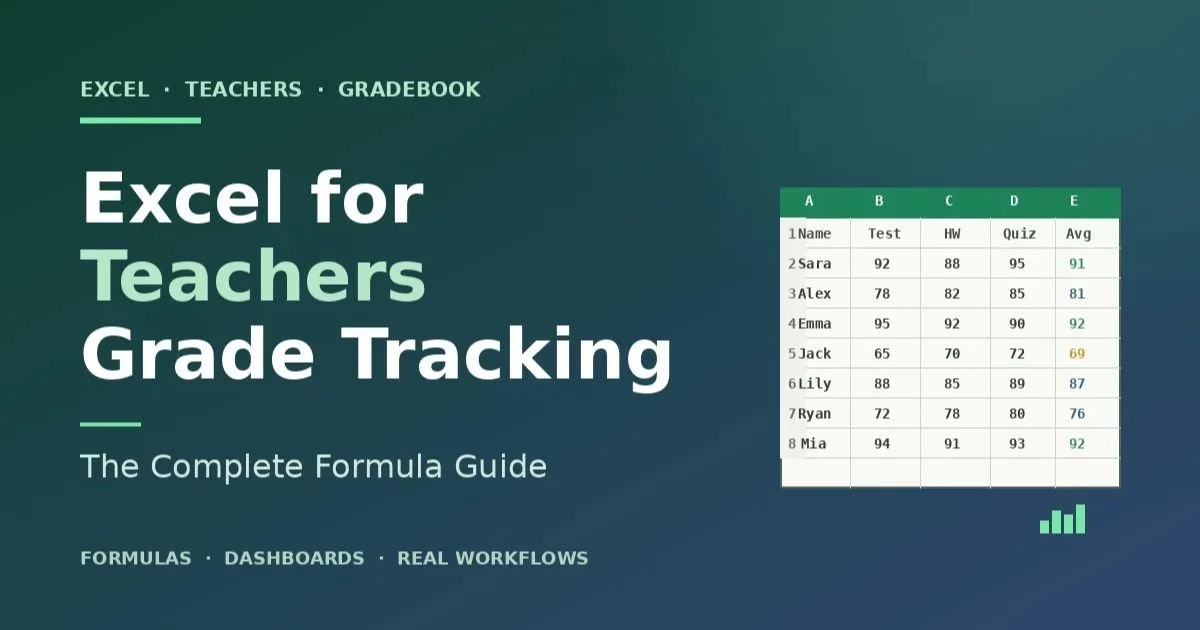
Teachers handle a surprising amount of data. Thirty students, twenty assignments per quarter, multiple subjects, weighted grade categories, and end-of-year reports that need to line up across every single number. The dedicated gradebook software most schools provide handles the basics, but it rarely does what an experienced teacher actually wants at report card time.
Excel fills that gap. A well-built teacher gradebook in Excel handles everything a district platform does, plus custom analytics, quick data import from quiz platforms, and dashboards that show at a glance which students need attention this week. It is also free with the Microsoft license most US schools already provide.
This guide covers exactly how experienced teachers build their gradebooks in Excel, which formulas do the heavy lifting, how to pull in quiz data from platforms like Kahoot or Blooket without retyping every score, and the mistakes that turn a promising Excel gradebook into a mess by mid-semester.
Why Do Teachers Still Use Excel for Grade Tracking in 2026?
Teachers still use Excel for grade tracking in 2026 because it offers flexibility that dedicated gradebook software rarely matches, costs nothing extra beyond the Microsoft license most schools already provide, and handles both routine calculations and custom analytics equally well. A well-built Excel gradebook works across devices, transfers between schools, and does not lock you into any single district platform.
Dedicated learning management systems like PowerSchool, Infinite Campus, or Google Classroom Gradebook handle the reporting requirements schools impose. What they do not do well is custom analysis. Want to see if your Tuesday quizzes correlate with test performance? The LMS will not tell you. Excel will, in about five minutes.
Portability matters too. Teachers change schools, districts, and platforms. An Excel gradebook goes with the teacher across every move without losing data or requiring migration. Every principal I have spoken to over the last decade has watched a veteran teacher leave and take a decade of grading insight with them, mostly because that insight lived in an Excel file the district platform never captured.
The other advantage is speed for common tasks. Weighted grade calculations, missing assignment flagging, and quick averages take under 10 seconds in Excel once the template is built. The same tasks in most LMS platforms require clicking through several menus. For teachers grading 150 students across five classes, those seconds compound fast.
There are places where Excel does not win. Parent-facing portals, integrated attendance, and district reporting all live better in dedicated systems. The best teacher setup uses both. The LMS handles official records and communication. Excel handles the day-to-day analysis that shapes teaching decisions.
How Do You Set Up a Teacher Gradebook in Excel Step-by-Step?
You set up a teacher gradebook in Excel by building a student roster tab, an assignments tab with categories and weights, a scores entry sheet, and a summary dashboard that pulls everything together. Start simple, get one class working end-to-end, then add features. Trying to build everything perfectly on day one is what causes most teachers to abandon Excel gradebooks by October.
Here is the workflow that experienced teachers actually follow when building a functional Excel gradebook from scratch.
Create a Student Roster tab. Column A for student ID (use the school's ID number, not a custom one), Column B for last name, Column C for first name, Column D for class period, Column E for any notes. This tab becomes the source of truth for every other sheet.
Build an Assignments tab. Each row is one assignment with columns for assignment name, category (homework, quiz, test, project), category weight, maximum points, due date, and a unique assignment ID. The category weights let Excel handle weighted grading automatically later.
Create a Scores entry sheet. Rows for students, columns for assignments. Use the student IDs from your Roster tab and the assignment IDs from your Assignments tab so formulas can pull data cleanly. Enter raw scores here, not percentages.
Add calculated columns for percentages. Use a formula like =IF(scoreCell="", "", scoreCell/maxPoints) so blank cells stay blank instead of showing errors. Missing assignments should look different from zeros because they mean different things.
Pull in data from other tools. Most quiz platforms export scores as CSV. Files from platforms like blooket.it.com, Kahoot, or Quizizz open directly in Excel and can be pasted into the Scores tab or linked with a VLOOKUP so updates flow automatically. Ten minutes of setup saves hours of retyping across a semester.
Build weighted category calculations. Use SUMPRODUCT to multiply scores by their category weights. A common formula pattern is =SUMPRODUCT((categoryRange="Test")*scoreRange*weightRange)/SUMPRODUCT((categoryRange="Test")*maxRange*weightRange). This handles missing assignments correctly.
Create a Summary dashboard tab. Pull each student's current grade using AVERAGEIFS or a lookup formula. Add conditional formatting to flag grades below 70 percent in yellow and below 60 percent in red. This is the tab you check daily.
Test with fake data before the semester starts. Enter three students, five assignments across two categories, and verify every calculation. Fix formulas now, not after real grades are in.
The whole build takes about two to three hours the first time. Subsequent gradebooks in later years take twenty minutes because you copy the template. That first investment pays back within the first month of use.
What Excel Formulas and Features Do Teachers Use Most for Grade Tracking?
Teachers use VLOOKUP or XLOOKUP for pulling data across sheets, SUMPRODUCT for weighted grade calculations, IF and IFERROR for handling missing scores, AVERAGEIFS for filtered class averages, and conditional formatting for visual flags on struggling students. Pivot tables come in for end-of-quarter analysis. Together these six features handle 95 percent of what a teacher gradebook needs.
VLOOKUP or XLOOKUP connects your Scores sheet to your Roster and Assignments tabs. Instead of typing student names on every scoring sheet, you type an ID and let Excel pull the name. This eliminates typos and lets you reorder students without breaking anything. XLOOKUP is easier syntax if you have Microsoft 365 or Excel 2021 or newer.
SUMPRODUCT is what makes weighted grading work. It multiplies arrays together in a single formula, so you can combine assignment scores with category weights without helper columns. A gradebook with tests worth 40 percent, quizzes 30 percent, and homework 30 percent runs off a single SUMPRODUCT formula per student.
IF and IFERROR handle the exceptions that trip up naive formulas. What happens when a student is absent for a quiz? What happens when an assignment is excused? These formulas let you build logic like "if the score is blank, exclude this assignment from the average" or "if the score is 'EX' for excused, treat it as if the assignment did not exist."
AVERAGEIFS filters averages by any criteria you want. Average of quiz scores for third period. Average of last month's homework. Average of tests for students with IEPs (individualized education plans). This function is what turns a gradebook into a source of insight rather than just a scorekeeper.
Conditional formatting provides the visual layer. Red for grades below 60 percent. Yellow for 60 to 70 percent. Green for above 90 percent. Icon sets showing trend arrows for students improving or declining. This is what makes the dashboard actually useful at a glance instead of forcing you to read numbers.
Pivot tables handle the end-of-quarter analysis. Which assignments had the lowest class average? Which category do most struggling students struggle with? Which day of the week produces the strongest attention on quizzes? Pivot tables answer these questions in under a minute once your data is structured properly.
Excel Features Teachers Rely On Most
For teachers using digital quiz platforms during the school year, integrating platform exports into an Excel gradebook removes hours of manual data entry. Data pulled from the Blooket Dashboard, Kahoot session reports, and Quizizz analytics all export to CSV, which Excel treats as native data. Setting up a formula-linked import once means every future quiz session updates automatically the moment you paste in the new file.
What Common Mistakes Do Teachers Make With Excel Gradebooks?
The biggest mistakes teachers make with Excel gradebooks are hard-coding student names instead of using lookup formulas, mixing raw scores with percentages in the same column, forgetting to protect formula cells so students accidentally get typed over calculations, and never backing up the file. Fix these four patterns and most Excel gradebooks survive the full school year without breaking.
Here are the five specific issues that show up in almost every Excel gradebook that stops working by mid-semester.
Mistake 1: Hard-coding student names across multiple sheets. Every time a student transfers in or out, you have to change their name in five places, and one of those changes gets missed. Use a single Roster tab as the source of truth, and pull student names into every other sheet with VLOOKUP or XLOOKUP formulas. Update one cell, and every sheet updates automatically.
Mistake 2: Mixing raw scores with percentages in the same column. Some cells show 85 (out of 100), some show 0.85, some show 17 (out of 20). By November, nobody remembers which is which. Pick one format for entry (raw score is easier) and calculate percentages in separate columns.
Mistake 3: Not protecting formula cells. Excel lets you lock specific cells so users cannot type over them. Teachers who share their gradebook file with colleagues, aides, or substitutes should absolutely use this feature. A single accidental keystroke on a SUMPRODUCT formula can silently break every calculation on the sheet.
Mistake 4: Never backing up the file. School laptops fail. USB drives get lost. OneDrive sync errors occasionally corrupt files. Set up a weekly backup to a second location (personal cloud, external drive, printed hardcopy for the paranoid) and you will never lose more than a week of work.
Mistake 5: Building for perfection instead of function. The teachers who successfully use Excel gradebooks for years start with a simple template and add features as they need them. The teachers who abandon Excel gradebooks by October usually tried to build a fully-featured system with charts, pivot tables, and dashboards on day one, before they even had real grades to work with.
One more issue worth naming: not learning the keyboard shortcuts. Ctrl+D fills down. Ctrl+; enters today's date. Ctrl+Shift+Enter used to matter for array formulas (less so now with dynamic arrays). Excel productivity for teachers doubles once these become muscle memory. A single hour of shortcut practice pays back within a week.
Frequently Asked Questions
Is Excel really better than a district-provided gradebook system?
Excel is not better at everything, but it is better at custom analysis, portability, and speed for common tasks. Most successful teachers use both. The district system handles official records, parent communication, and reporting. Excel handles the day-to-day analysis and any custom calculations the district platform does not support.
Do I need advanced Excel skills to build a teacher gradebook?
No. A functional gradebook uses about eight formulas total: SUM, AVERAGE, VLOOKUP or XLOOKUP, IF, IFERROR, SUMPRODUCT, AVERAGEIFS, and COUNTIF. All are covered in any basic Excel tutorial. You can learn everything you need in about four hours of focused practice, then build competence over a couple of weeks of actual use.
How do I import quiz scores from Blooket or Kahoot into Excel?
Both platforms export session results as CSV files. Download the CSV, open it in Excel (it will open natively without conversion), then either copy-paste the relevant columns into your gradebook or use VLOOKUP to pull matching student scores automatically. Set the naming convention on the platform side to match your gradebook student IDs.
Should I use Google Sheets instead of Excel for grade tracking?
Google Sheets works for most gradebook needs and syncs across devices without setup. Excel handles large datasets and complex formulas faster. Teachers already on Google Workspace often stay with Sheets. Teachers on Microsoft 365 usually prefer Excel. The formula syntax is nearly identical, so migration between them is straightforward if needed.
How do I handle weighted grades in Excel?
Use SUMPRODUCT with two arrays: one for scores, one for category weights. A formula like =SUMPRODUCT(scores * weights) / SUMPRODUCT(maxScores * weights) returns a properly weighted percentage. Store category weights on your Assignments tab so changing one weight cell updates every student's grade automatically.
Can I share my Excel gradebook with parents or students?
Yes, but carefully. Never share the master file. Instead, create a filtered view showing only one student's data, save it as a PDF or a locked read-only Excel file, and share that. Cloud platforms like OneDrive and Google Drive let you share links with view-only permissions if you prefer a live share over static reports.
How do I make an Excel gradebook mobile-friendly?
Excel on iPad and mobile works well for viewing but is painful for data entry. Most teachers use their laptop or desktop for grade entry and their phone or tablet only for quick lookups. Keep your dashboard tab uncluttered so it reads well on smaller screens, and put the data-entry sheets on tabs designed for full-screen laptop use.
What is the best Excel template for teachers just starting out?
Search for "teacher gradebook template" on the official Microsoft template gallery or on education-focused sites. Pick one with clearly labeled tabs and simple formulas rather than a template with 15 sheets and unclear structure. Modify it to match your needs rather than building from scratch. Most templates need only 30 minutes of customization to fit any specific class.
Getting Your Excel Gradebook Working This Week
An Excel gradebook is one of those tools that saves teachers hours per week once it is set up properly, but that saves nothing at all if it never gets built. The reason so many teachers use half-broken Excel files is that they tried to build everything perfectly on day one and gave up when it took too long.
Start smaller. Pick one class. Build a single-tab gradebook with a student roster, five assignments, and a running average. Get that working end-to-end before adding weighted categories, imports, or dashboards. That single-tab version will handle 80 percent of what a full teacher gradebook does and it takes about an hour to build.
Layer in the more advanced features as you need them, not before. Weighted grading when your first tests come in. CSV import when you start using quiz platforms weekly. Pivot tables at the end of the quarter when you actually have enough data to analyze. Each addition takes 20 to 30 minutes and pays back within days of implementation.
For teachers who want the shortcut, hiring an Excel specialist to build a custom gradebook template around your specific school and subject setup usually costs less than a weekend workshop and produces a template that works for years. Either path (self-built or expert-built) beats fighting with the district system for tasks it was never designed to handle.
